


New ECG workstation
Design of a new, modern, and optimized workstation, aligning clinical needs, operational efficiency, and technological advancements at Micromed.
YEAR
2024
COMPANY
Micromed
ROLE
Research
User interviews
Journey maps
Data analysis
UI
Prototyping
Usability tests
Reffining
Beta testing
Follow UP
01.
Overview
Micromed is a leading player in cardiology in Brazil. This project involved the complete replacement of the legacy Thundera platform with a new workstation for medical reports. The goal was to modernize the technology and, most importantly, to solve critical usability issues that impacted medical efficiency.

+1200
Users doctors


2.5mi
Exams per year

+450
Centers reporting exams
02.
The Challenge
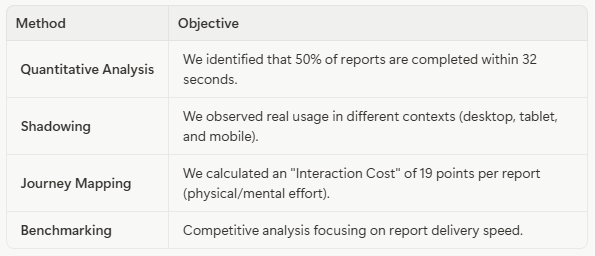
In cardiology, "time is muscle". Doctors deal with thousands of exams daily, and every second saved in the reporting process directly impacts patient response time.
The Problem
The previous platform presented:
- Legacy Technology: Difficulty and high cost to implement improvements.
- Workflow Friction: An average of 6 clicks to perform a simple report.
- Cognitive Load: Outdated interface, making it difficult to prioritize critical exams.
- Instability: Frequent logouts required repetitive authentication workflows.
Key Metric: Reduce the average reporting time while maintaining clinical safety.
Key Metric: Reduce the average reporting time while maintaining clinical safety.
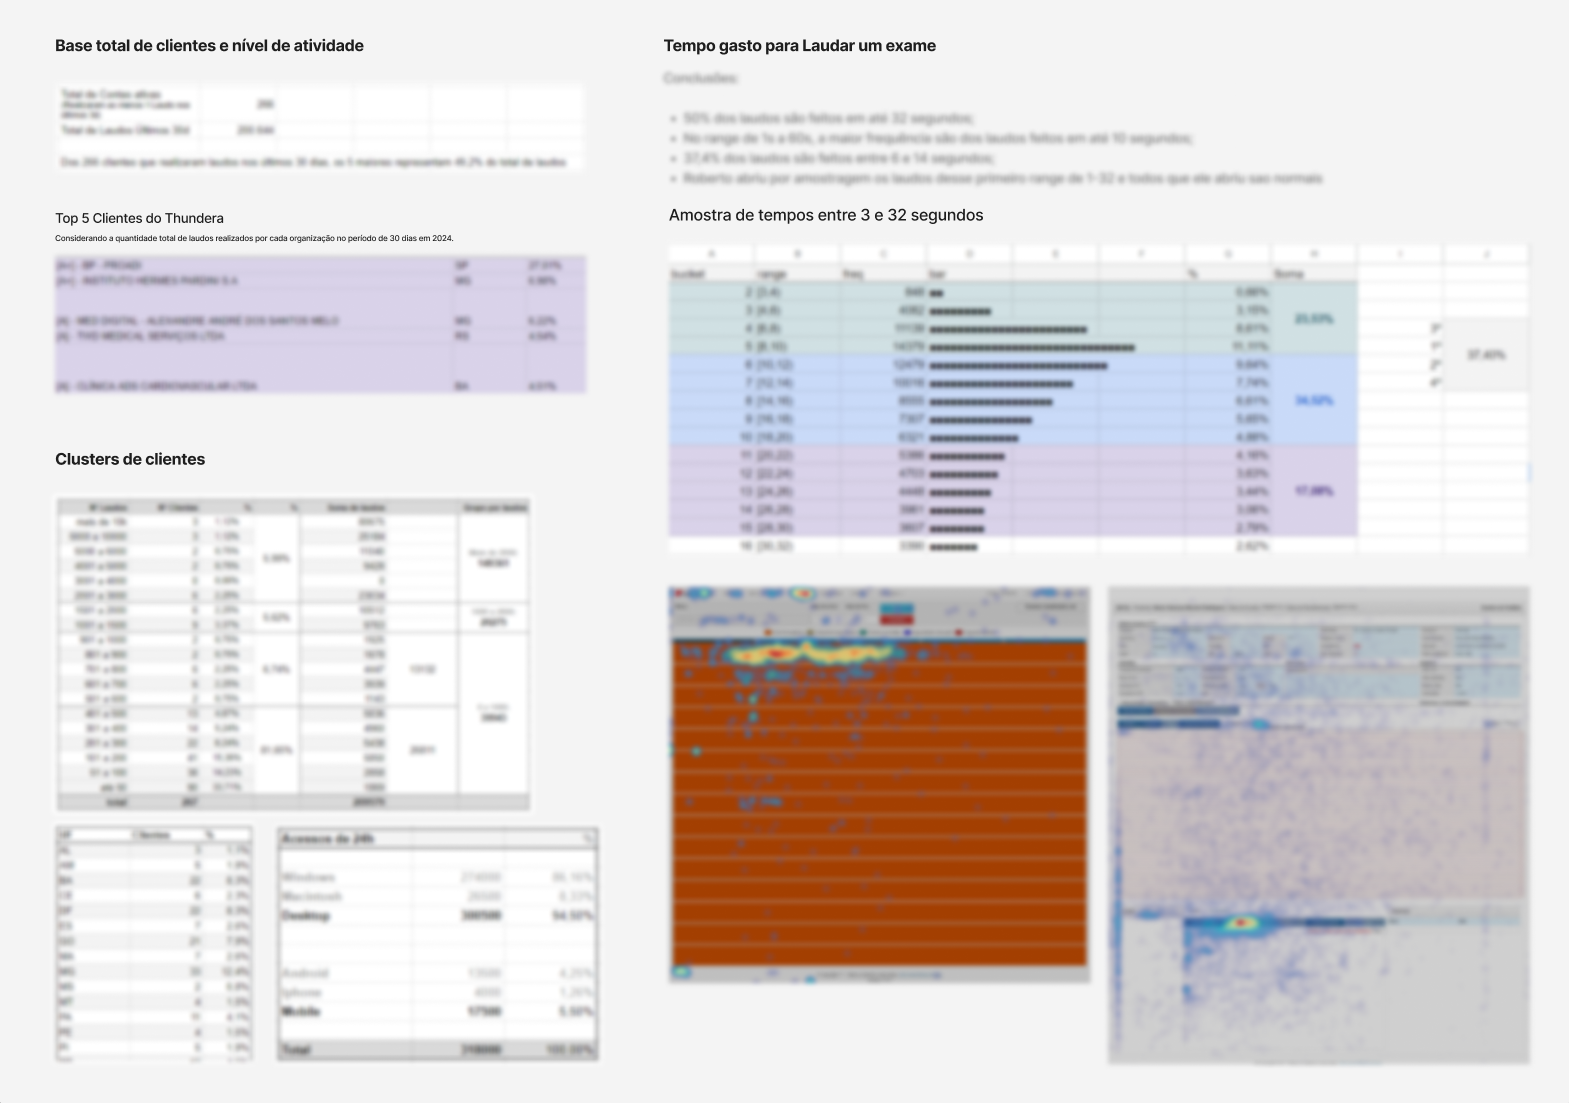
(Data dashboard in Figjam with charts, heatmaps, and key usage numbers.)
03.
Discovery Process
We began with a deep dive into the telemedicine ecosystem, visiting and interviewing doctors at reference institutions: Albert Einstein, Beneficência Portuguesa (BP), InCor, and Samaritano.
User interviews
8
Users interviewed

4
Hospitals visted

5
Days shadowing
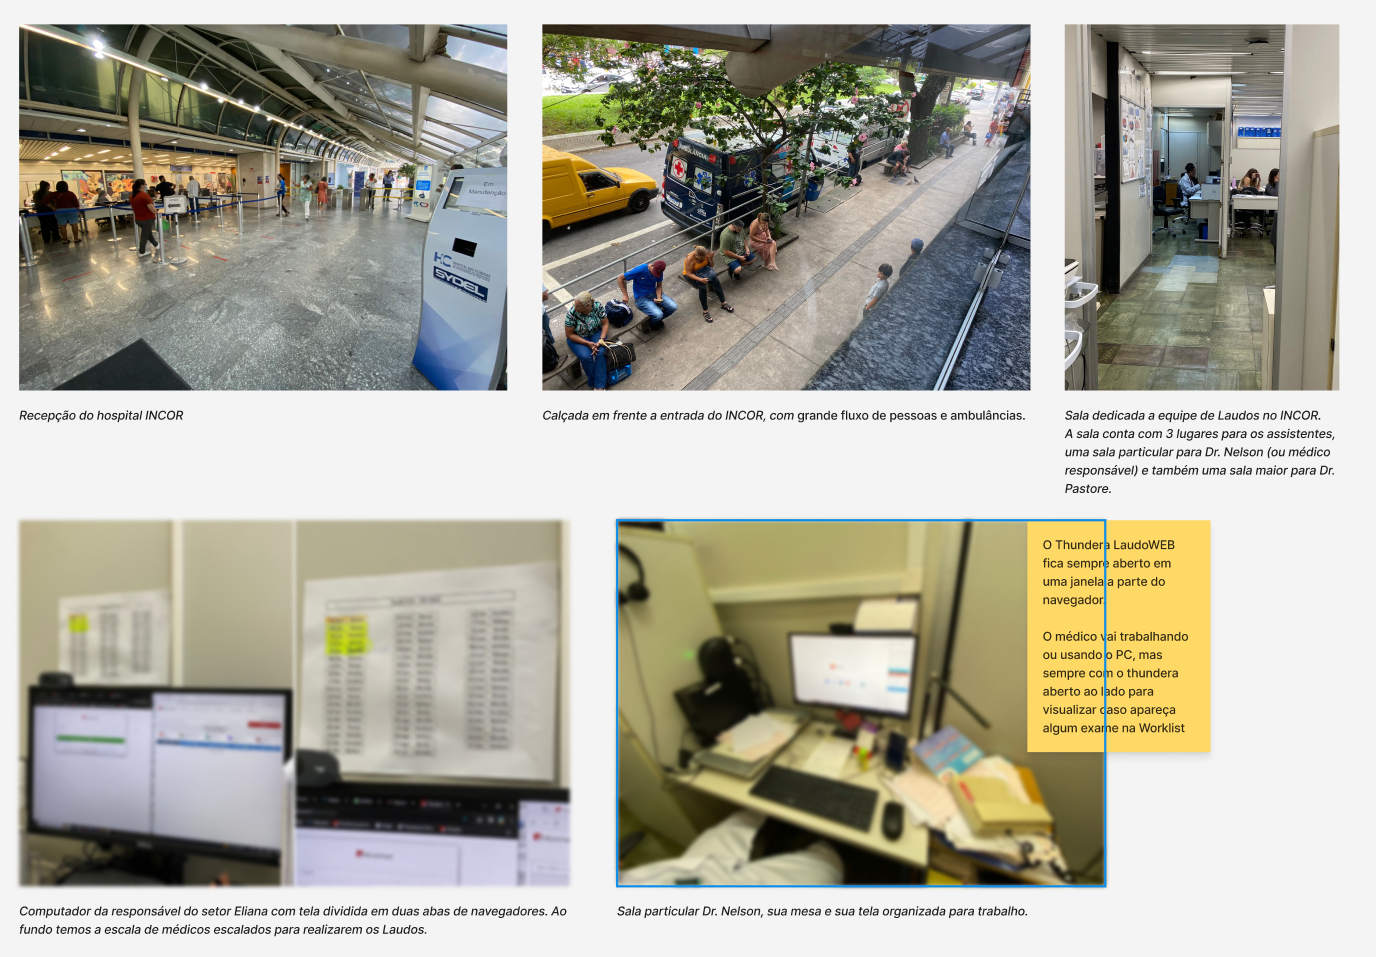
(Photos of hospitals visited, showing staff rooms and desks/work environment)
(Photos of hospitals visited, showing staff rooms and desks/work environment)
Some key Insights
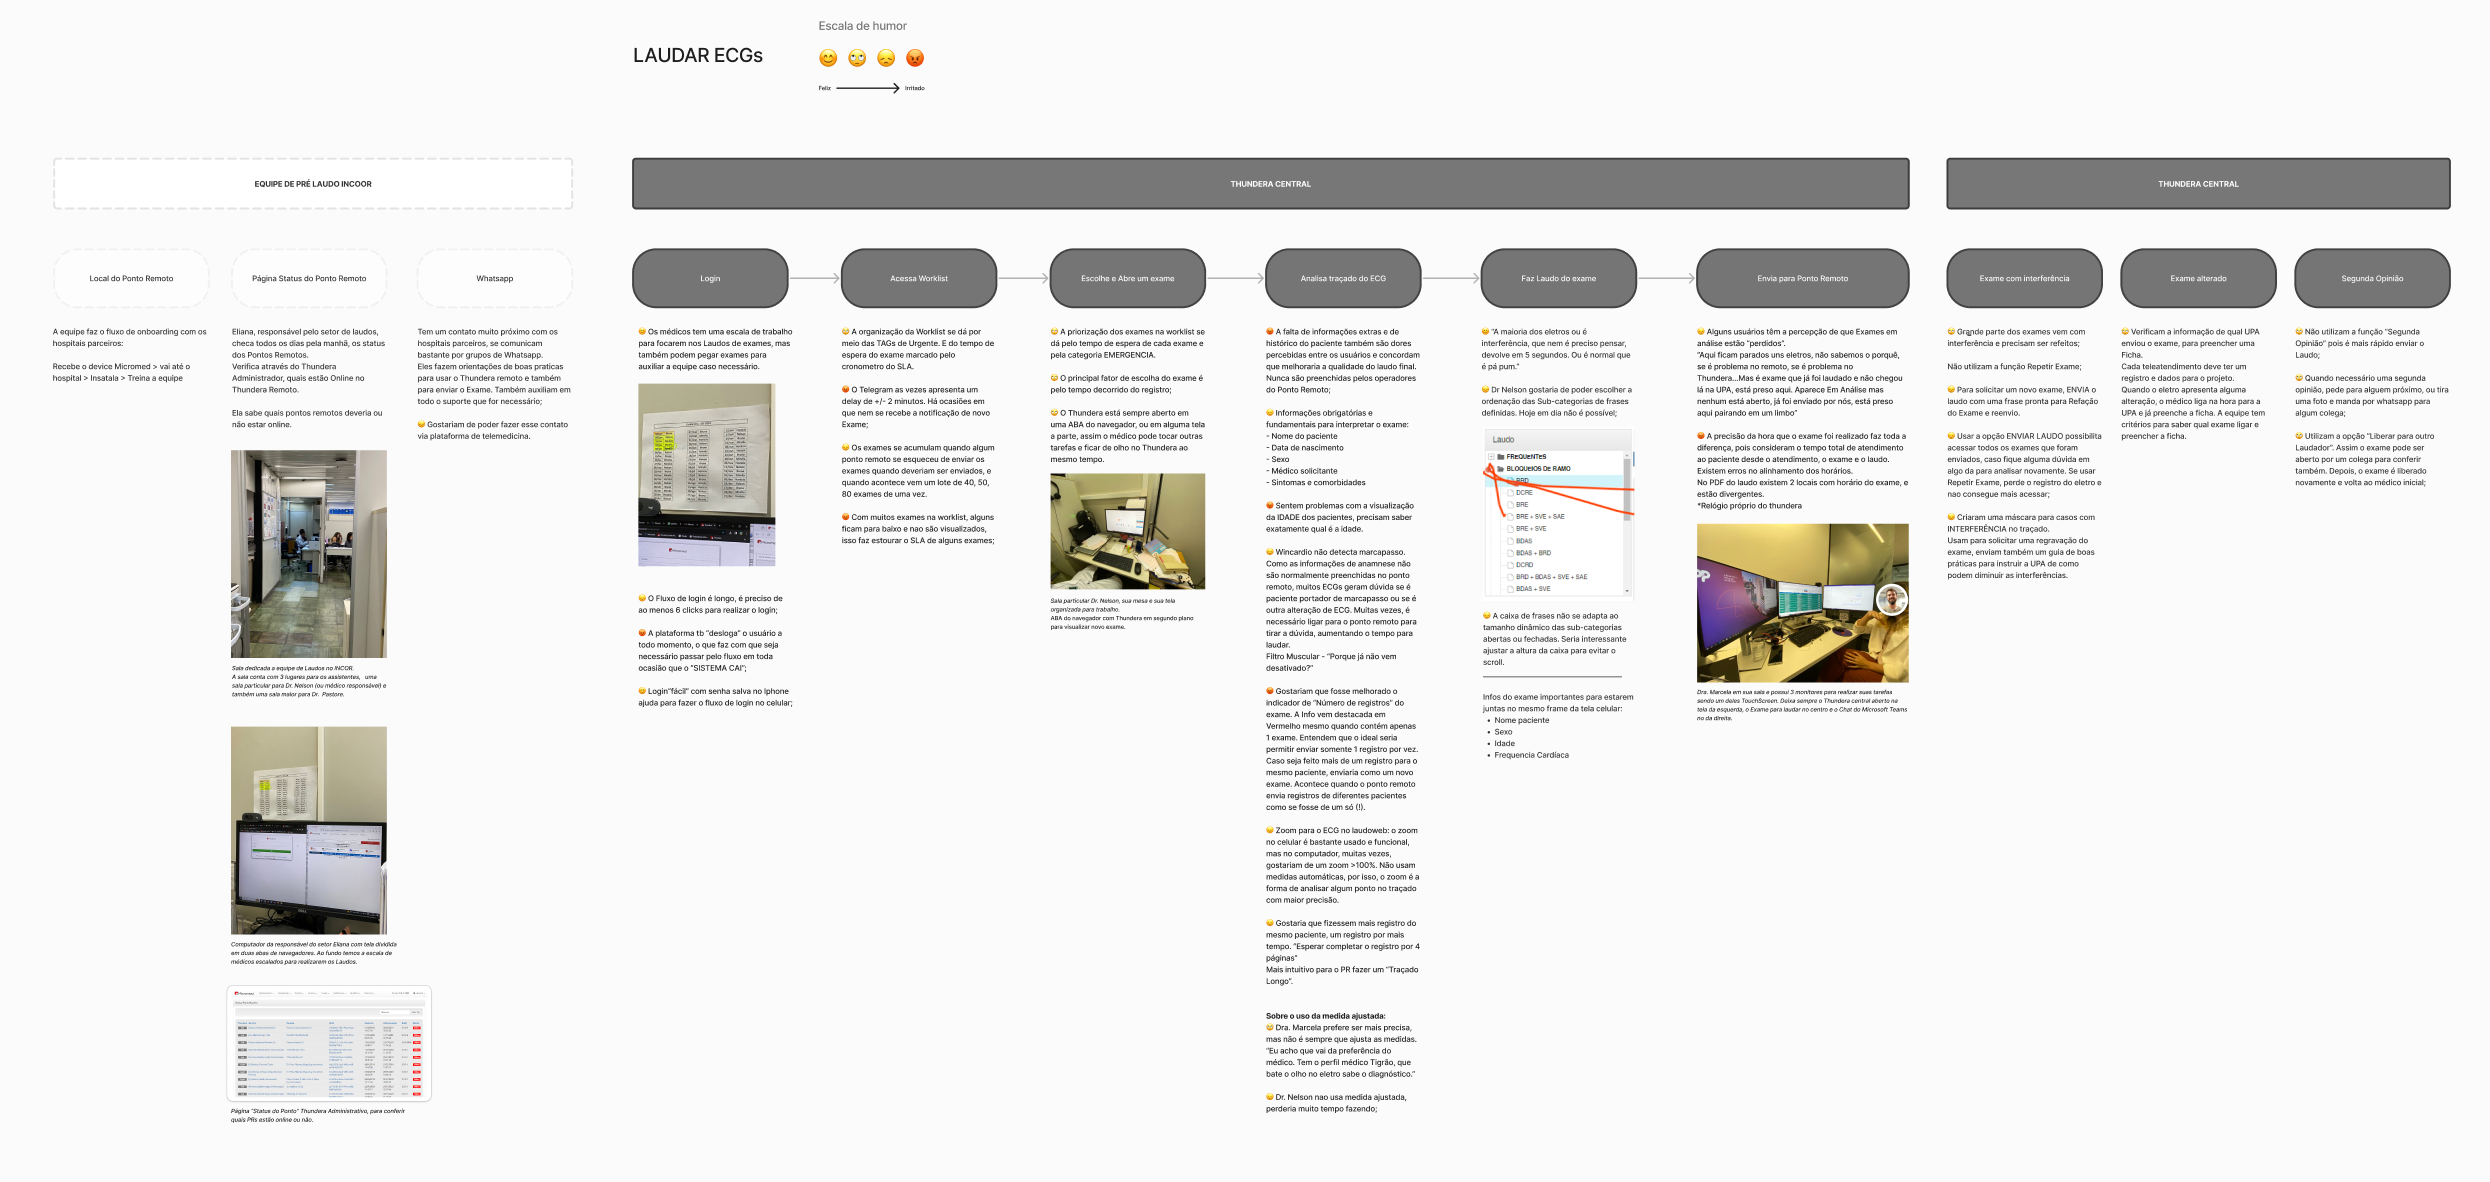
- The Continuous Flow: Doctors desired an automatic "next exam" dynamic, without having to return to the main list.
- Critical Data: Information such as Age, Sex, and Heart Rate are fundamental for interpretation and needed greater prominence.
- The "Tigrão Doctor": Experienced doctor profile seeking extreme speed; for them, the system should be as agile and direct as possible.
04.
The solution
We designed the new workstation focusing on performance, clarity, and predictability.
Pillars of the New Interface
- Click Optimization: Drastic reduction in steps for submitting normal reports (higher volume).
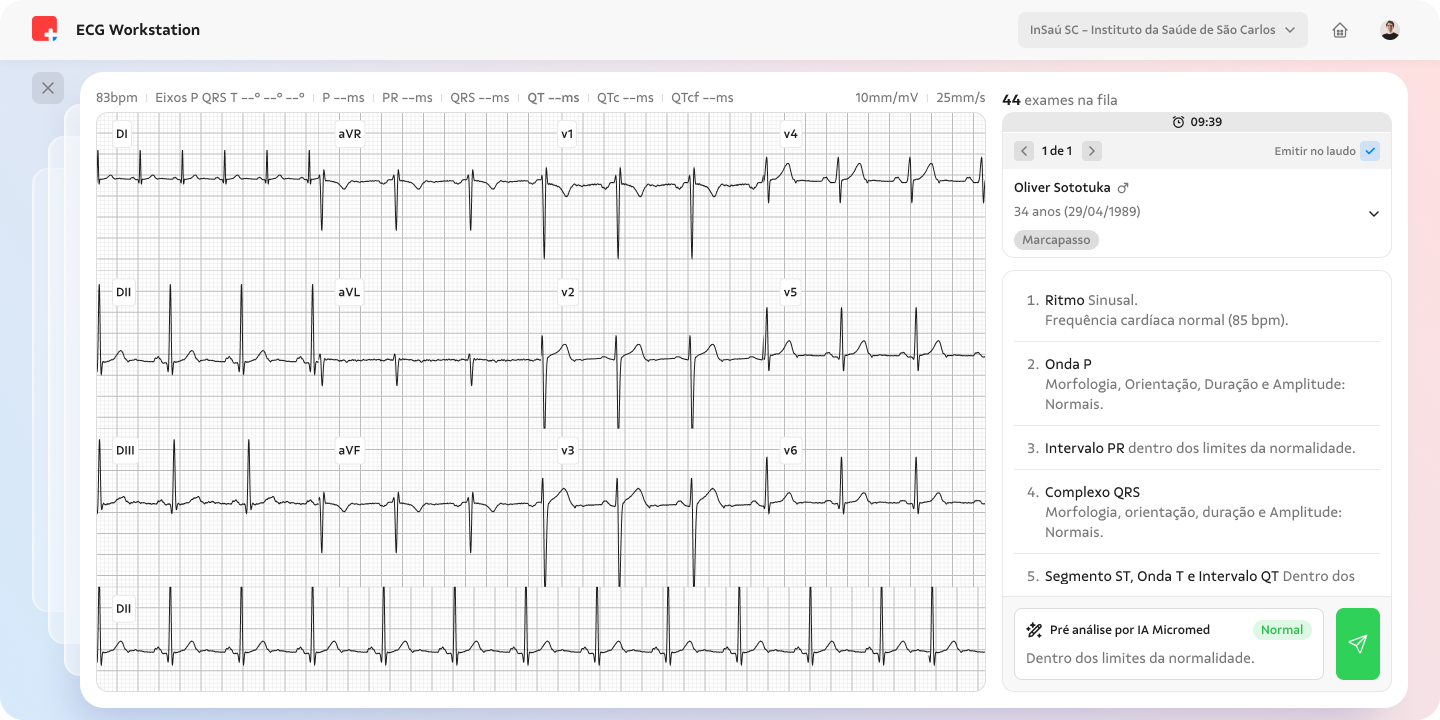
- Visual Hierarchy: Patient data and ECG tracing gained prominence, with enhanced zoom tools.
- High-Demand Workflow: Implementation of the sequential reporting mode to optimize work in large centers.
- Pre-analysis AI: Training and implementation of Micromed's own AI for screening exams and ordering worklists.
05.
Validation and Iteration
To ensure the effectiveness of the solution, we conducted rigorous testing cycles:
Usability tests:

8
Tests performed

8
SUS Forms
Usability Tests: 8 remote sessions with doctors performing real tasks.
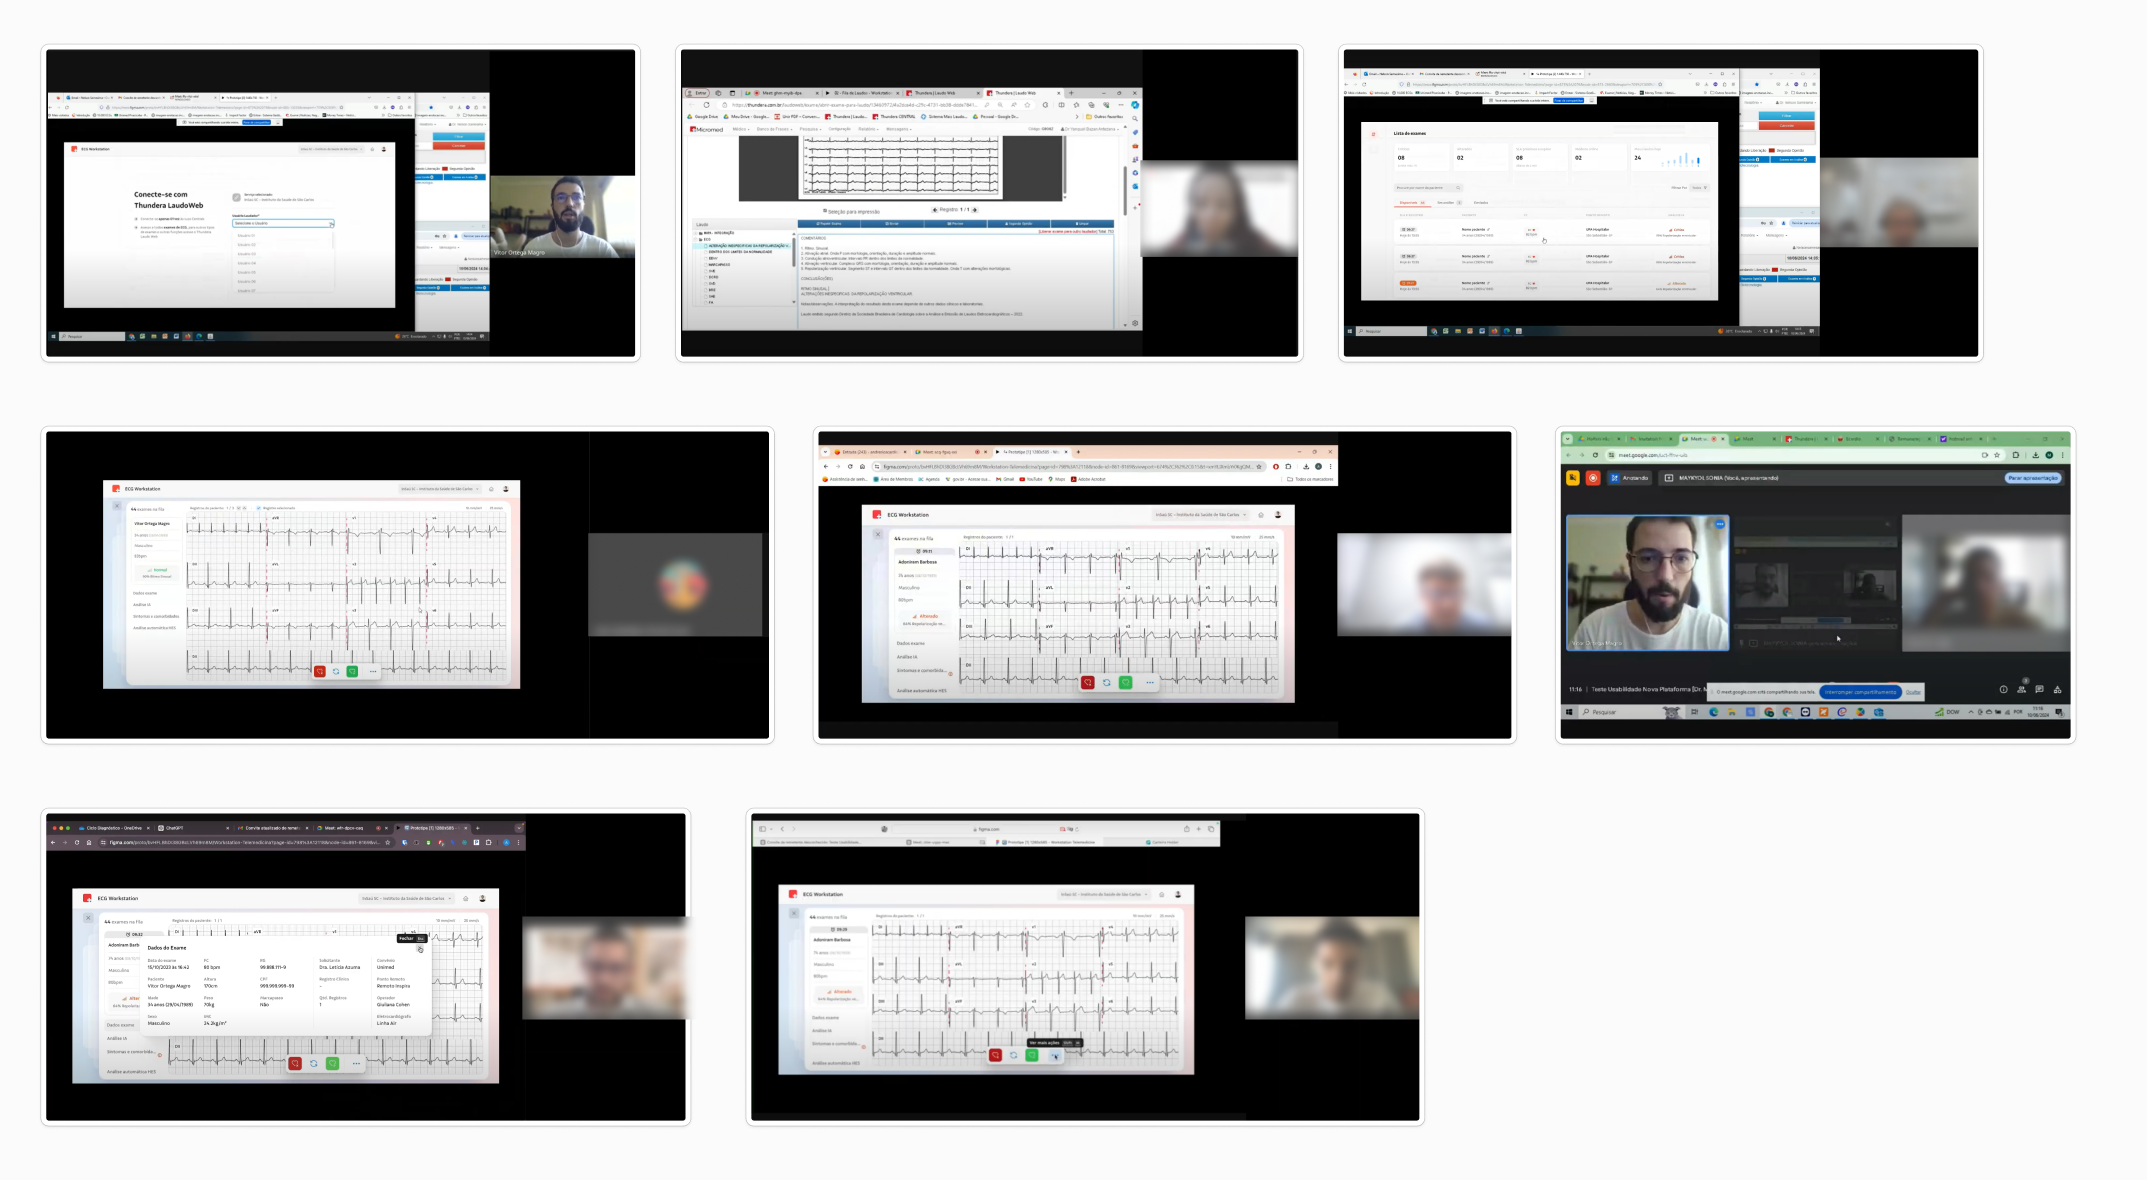
(Photos of hospitals visited, showing staff rooms and desks/work environment)
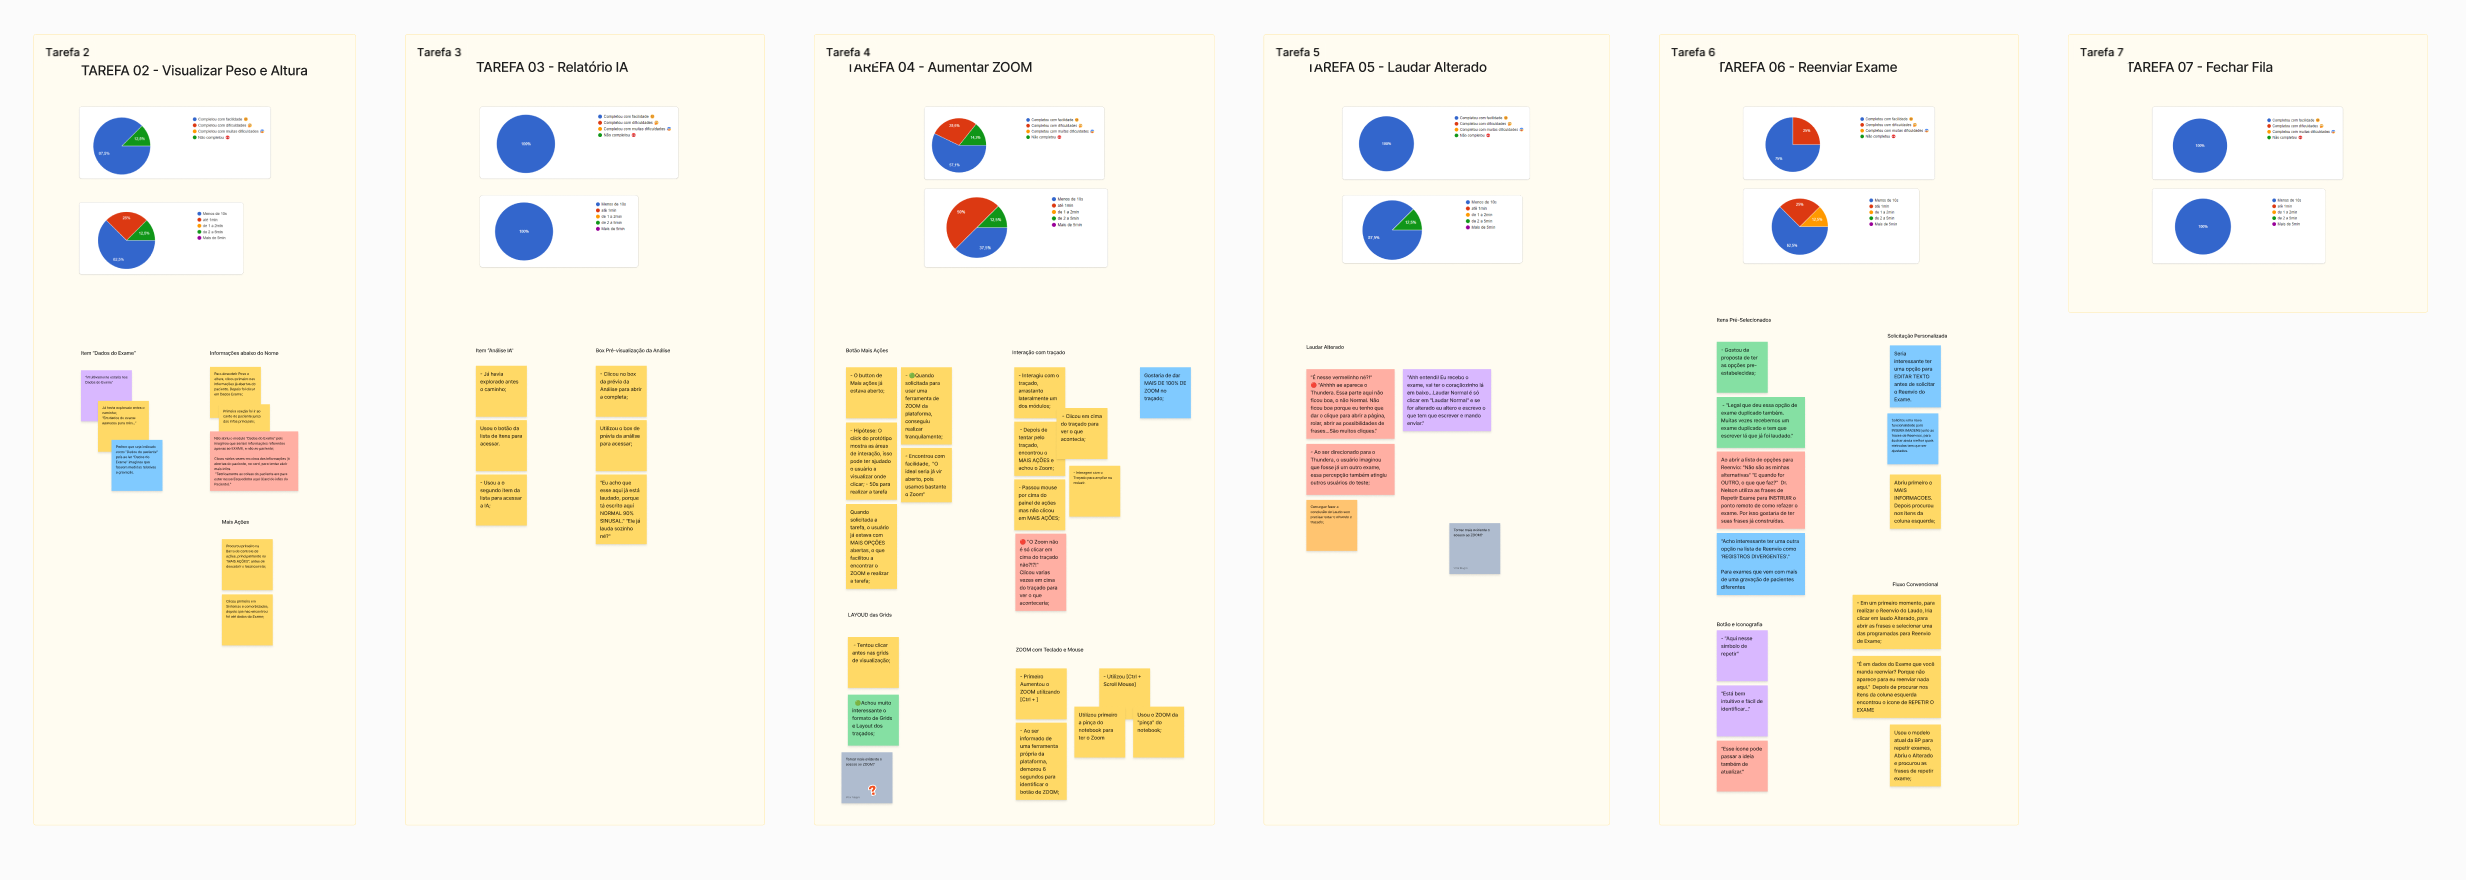
(Charts, results, and insights from completed tasks.)
Success Metrics: Application of the SUS (System Usability Scale) questionnaire to measure usability perception.
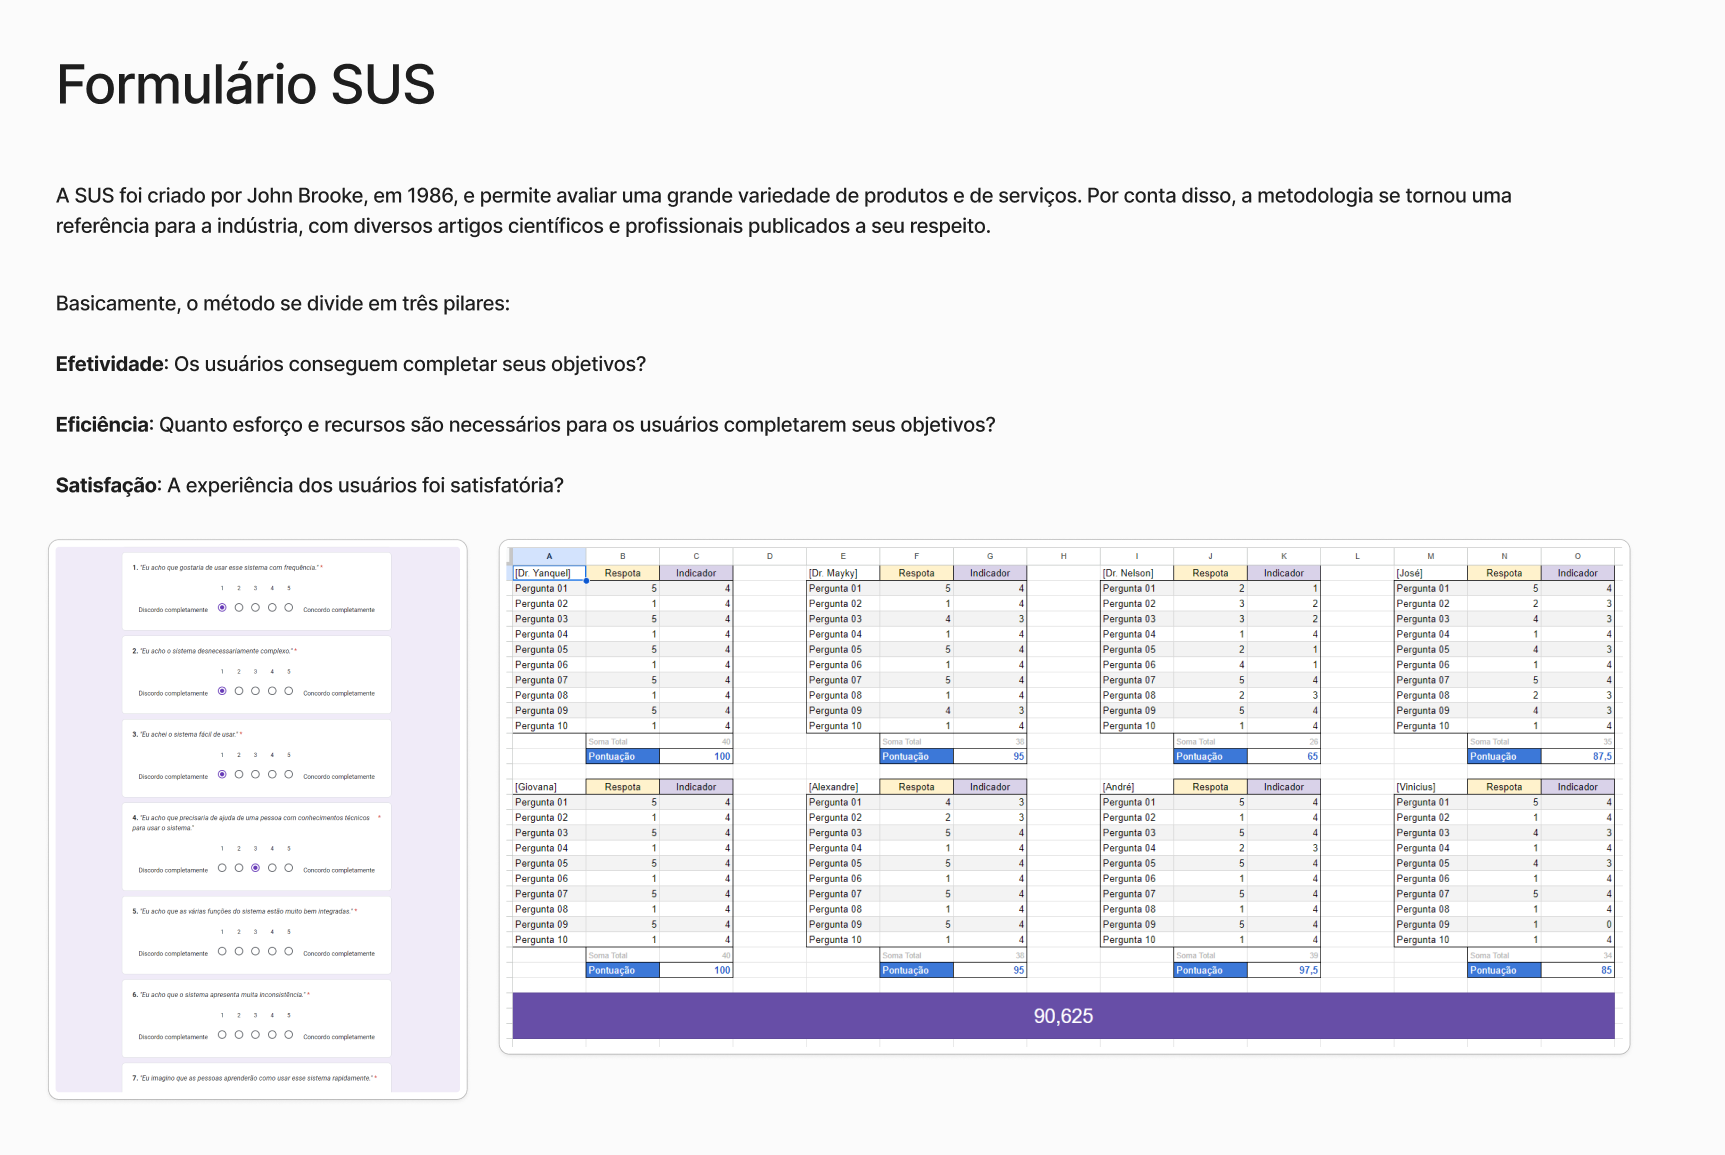
(Results from the SUS form and tabulation of data by user.)
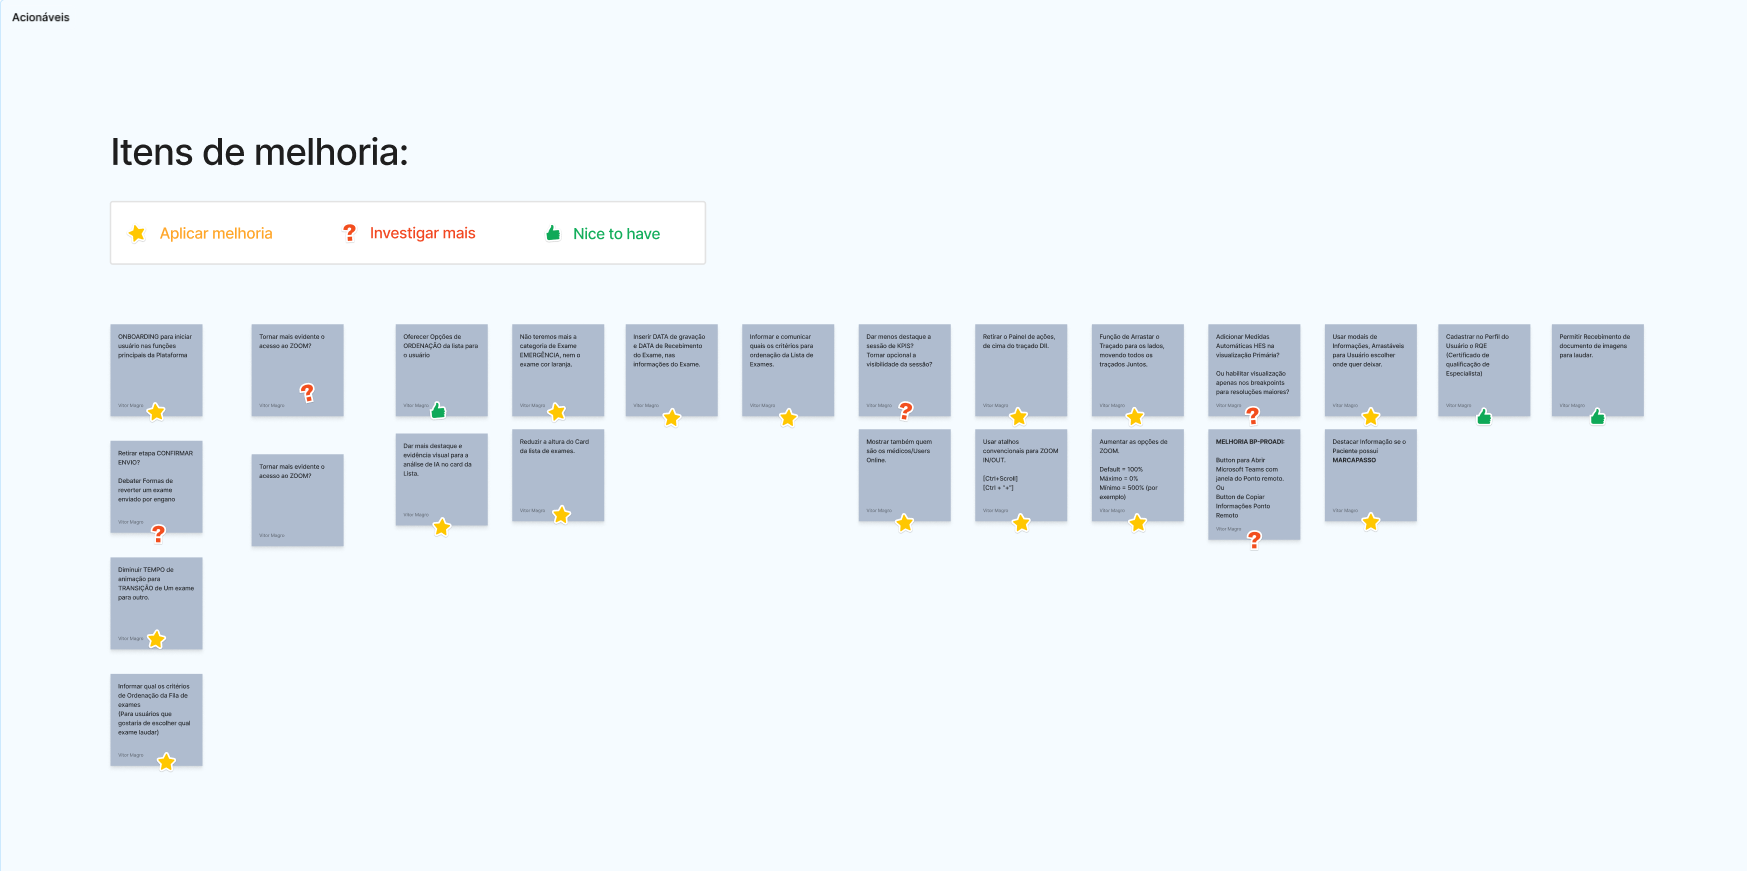
Design Adjustments:
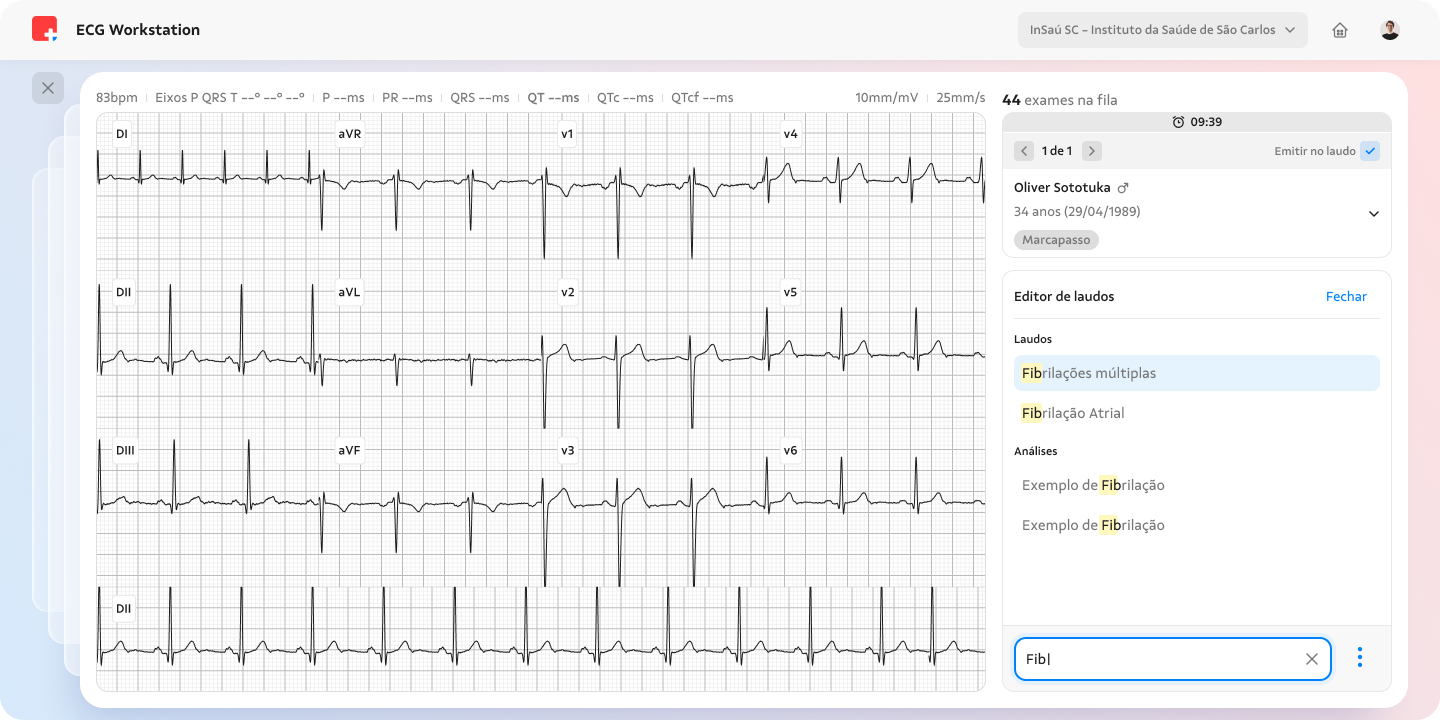
Design Adjustments: We refined the ready-made phrase box and the signaling of exams with interference after feedback from tests.
Beta Test: Controlled launch at Beneficência Portuguesa for validation in a real, high-pressure environment.
06.
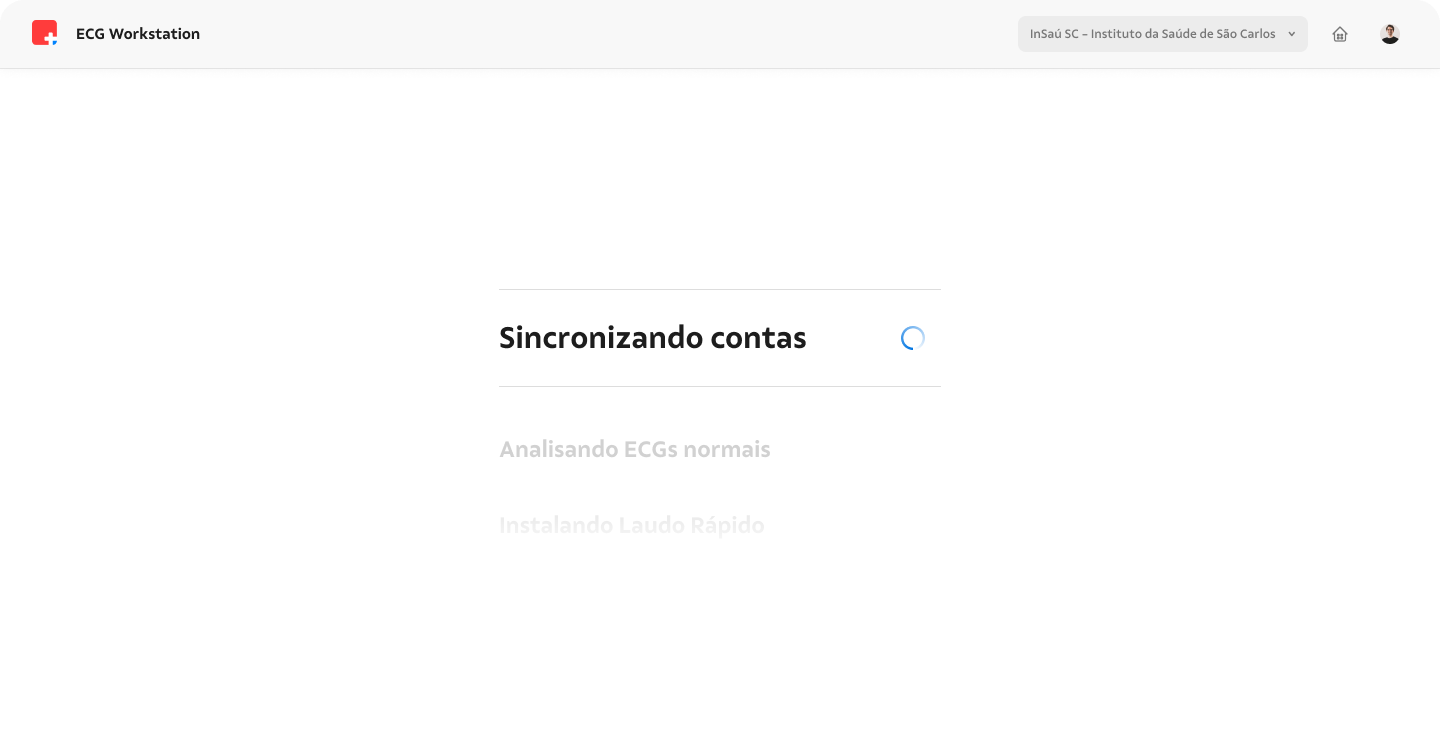
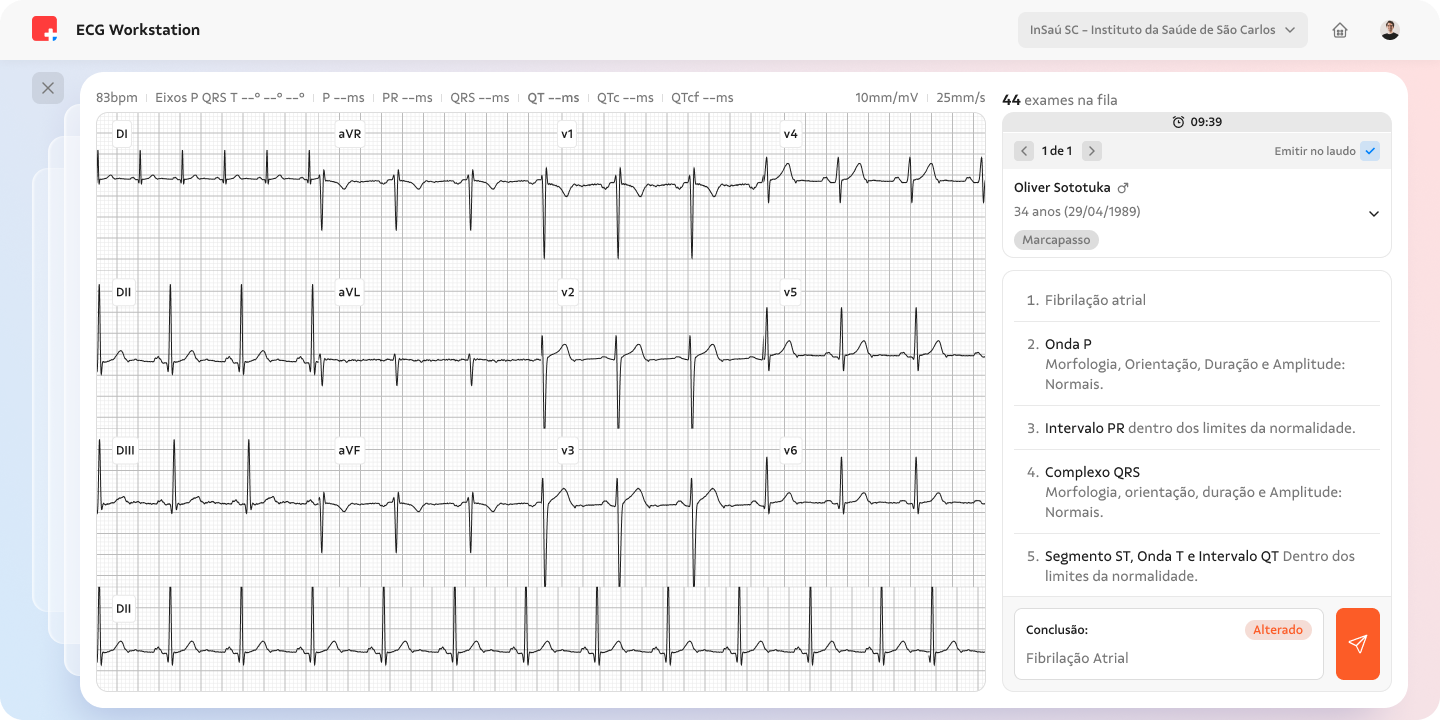
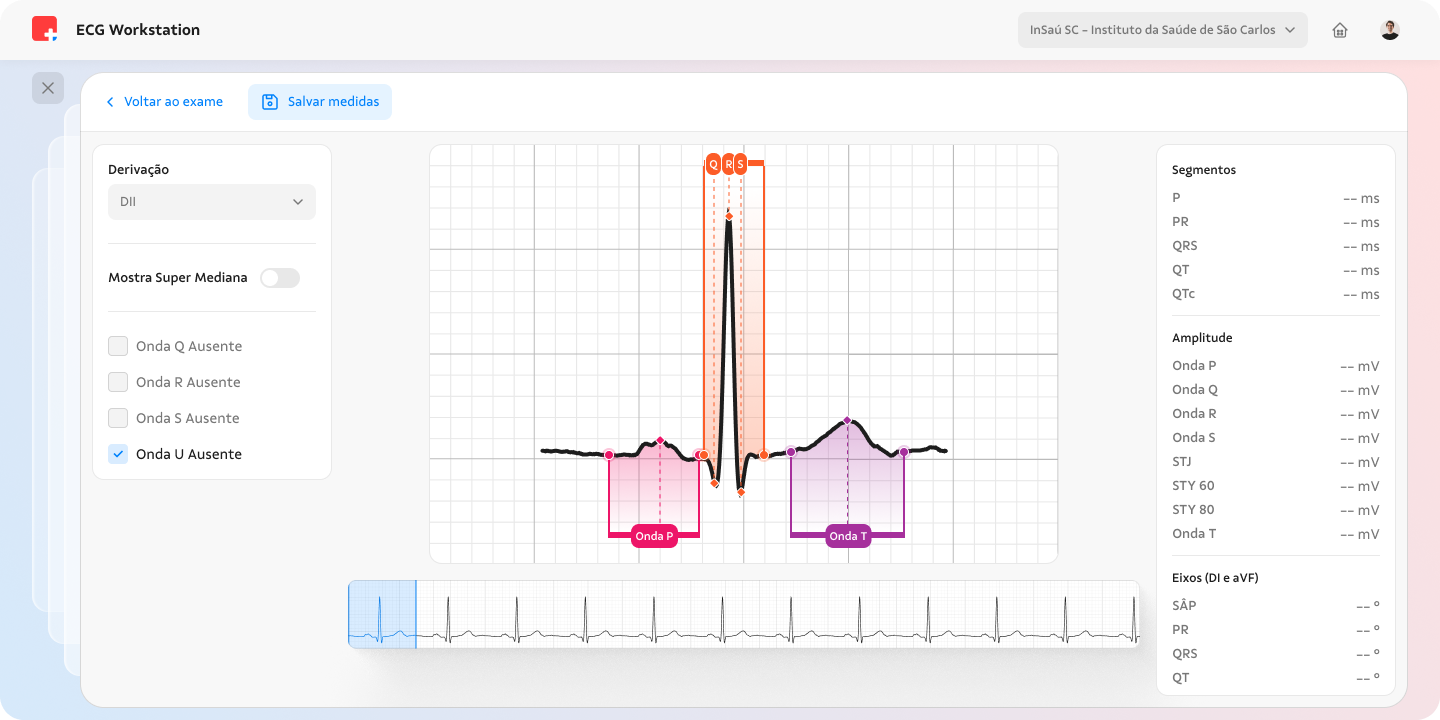
User Interface
Controlled launch at Beneficência Portuguesa for validation in a real, high-pressure environment.
07.
Beta Test
The beta test was conducted with cardiologists at Beneficência Portuguesa, comparing the previous platform with the new Workstation.
The results validated the core goal of the project: significantly reducing report turnaround time.

38%
Within 5 seconds: a total leap in efficiency
From 0%

TO 38%
233%
Normal reports completed within 10 seconds
From 21%
TO 71%
21%
Normal reports completed within 10 seconds
From 21%
TO 71%

63%
Reduction in expired SLAs for critical reports
Parameters:
10/14/2024 to 11/12/2024, tested by 18 of 42 doctors, 62,850 reports issued during the period, 2,984 in the new interface.


